

MANCHESTER, NH – The median sales price for a single-family home in New Hampshire hit a record high in May, but Manchester kept things cool with an MSP more than $100,000 below the state’s.
May statewide median sales price was $576,000, but key sales indicators were all strong despite the record high, according to the New Hampshire Association of Realtors monthly market report.
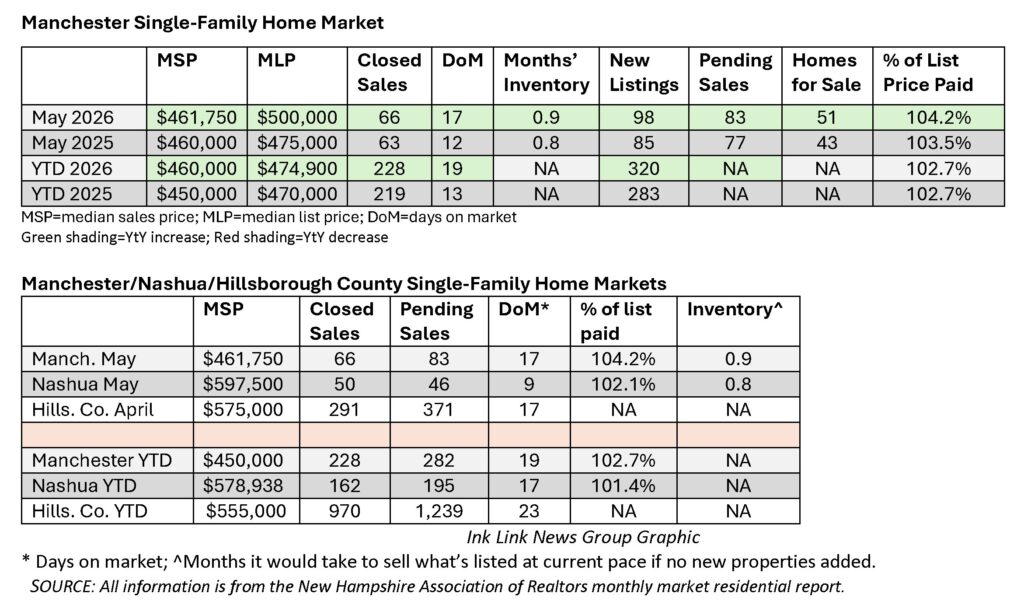
Meanwhile, Manchester’s single-family home median sales price was $461,750, just 0.4% higher than it was a year ago, despite the city’s super-tight inventory that has homes staying on the market an average of less than three weeks.
Strong sales signs in the statewide market may eventually lead to a slowdown on skyrocketing home prices, but it wouldn’t be until after what could be more record prices this summer.
“While New Hampshire has experienced strong home price growth for several years, it is unusual to see a new statewide price record established in May,” said Josh Greenwald, 2026 NHAR president, in a news release. “Historically, home prices tend to peak in June or July. If those seasonal trends continue, it’s likely we’ll see even higher median prices during the summer months.”
The state’s $576,000 MSP is 6.7% higher than the May 2025’s $540,000, and eclipses the previous record of $569,000 set in June 2025 by 1.23%. Median means that half of the homes sold for more than the median and half for less. Single-family home statistics provided by the NHAR are for existing homes that are listed with the multiple listing service and don’t include ew construction.
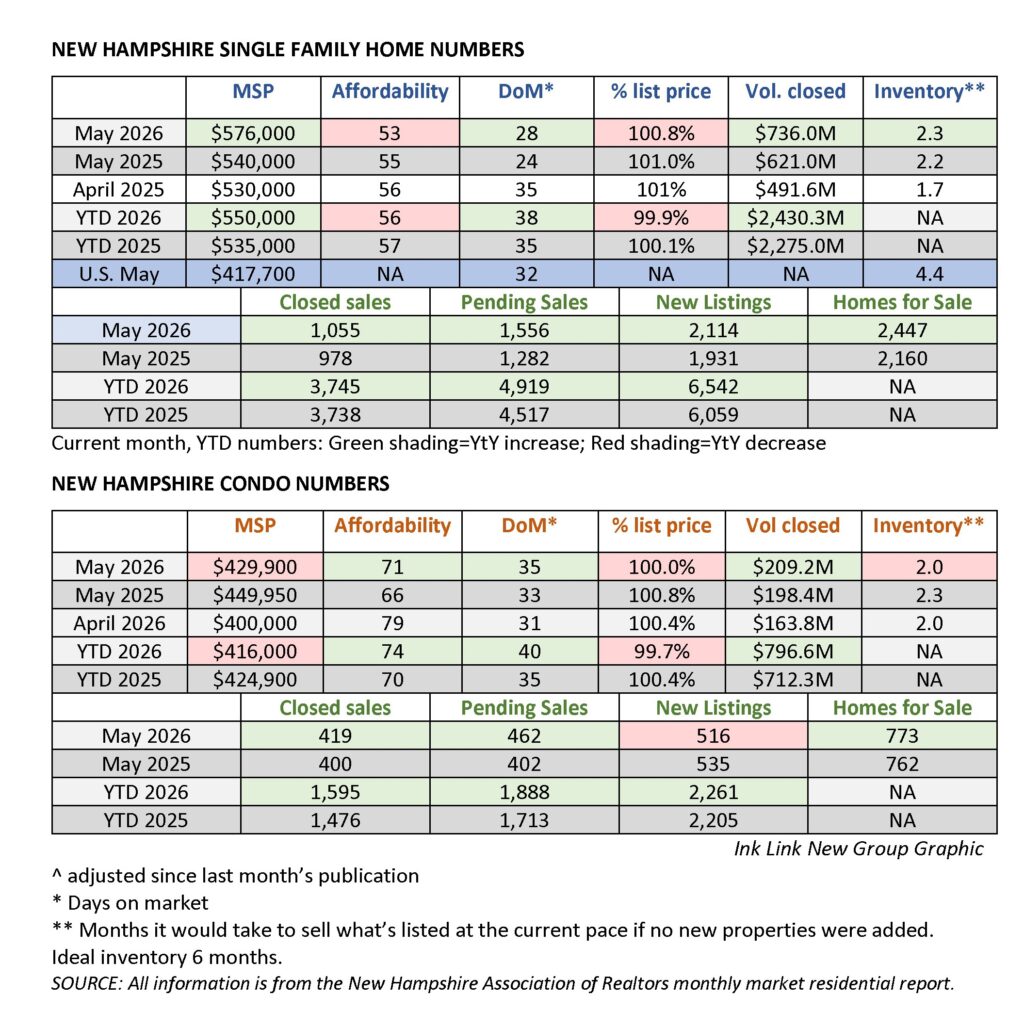
A near-record in May was homebuyer’s affordability index, which tied the all-time low of 53, set in June 2025. The number means that the median income in New Hampshire is 53% of what is needed to cover the monthly costs of owning a median-priced home, including mortgage payment, insurance and property tax.
Slightly tempering the record-high price and low affordability are key sales indicators that continue to improve, most notably inventory and pending sales.
Inventory is up 4.5% from last May, to 2.3 months’ supply, which means that if all the properties on the market were sold at the pace they’re selling now with no new ones added, it would take 2.3 months for them all to sell. A 6-month supply is considered necessary for a healthy market.
Inventory has been slowly increasing since dropping below 2 months for much of 2020 through 2023. It hit 2.5 in June 2025 for the first time since 2019, and toggled between 2.5 and 2.6 through October, before dropping to 2 in November.
The June through October 2025 inventory is the best run it’s had since it went below 3 months’ supply for the first time ever, hitting 2.9 in November 2019, then 2.4 that December. By May 2020, inventory was 2.1 and by August 2020 it was below 2, where it stayed, frequently dropping below 1 month’s supply until September 2023, when it climbed to above 2 for the fist time in more than three years, to 2.1.
“While inventory has improved from the record lows we experienced several years ago, New Hampshire remains far from a balanced housing market,” Greenwald said. “Until we significantly increase the number of homes available for purchase, affordability will remain a challenge for many Granite State families.”
Pending sales in May, at 1,556, were 21.4% higher than a year ago, and the highest they’ve been in four years, another positive sign.
“Pending sales activity demonstrates that demand remains exceptionally strong, even as many households struggle with limited inventory, higher mortgage rates and rising prices,” Greenwald said.
Closed sales, which were down in April and for the first quarter of the year, rebounded in May, with a 7.9% increase over May 2025. That was good enough to push the number for the year to date higher than last year’s, a 0.2% increase to 3,745 from 3,738.
Other May key sales indicators also show a strengthening market, with year-over-year increases to new listings (9.5%) and overall homes for sale (13.3%).
Buyers, aside from the high sticker price, got a marginally better break in May than a year ago. Homes stayed on the market an average 28 days, compared to 24. They paid an average 100.8% of list price compared to 101.0% a year ago.
Buyers looking for a break in the much smaller condominium/townhouse market got one, as long as they could find something to buy.
Median sales price for condo/townhouse properties was $429,900, down 4.5% from $449,950 a year ago, with an affordability index of 71, up from 66 in May 2025.
But inventory was 2.0, down from 2.3 a year ago.
There were more closed sales (4.8%), pending sales (14.9%) and overall properties for sale (1.4%), but pending sales were down 3.6%.
Buyers paid an average 100% of list price, compared to 100.8% a year ago, and properties stayed on the market an average 35 days, compared to 33 in May 2025.
Manchester, county markets
Manchester’s May MSP of $461,750 was only 0.4% higher than May 2025’s $460,000, well below the state MSP as well as Hillsborough County’s $575,000 May MSP.
Manchester sellers were more optimistic about price in May than they were a year before, with a median list price of $500,000, compared to $475,000 a year ago.
Buyers paid an average 104.2% of list price in May, compared to 103.5% a year before, indicative of the chronically tight inventory in the city. With inventory supply at 0.9, properties stay on the market for an average 17 days. That’s slightly better than a year ago, when inventory was 0.8 and average days on the market was 12.
Sales indicators show the Manchester market may loosen up eventually. Closed sales were up 4.8%, pending sales were up 7.8%, new listings were up 15.3% and overall homes for sale were up 18.6% from May 2025.
Five months into the year, the year-to-date MSP in the city is $460,000, up from $450,000 at this time last year. All sales indicators have increased year-over-year, with closed sales up 4.1%, pending sales up 10.6%, and new listings up 13.1%.
In Hillsborough County, closed single-family home sales are up 27.1%, with 291 homes sold in May compared to 229 in May 2025. The county, which also includes Nashua, represents about 30% of the state’s population.
Pending sales are up 13.1% and properties stay on the market an average 17 days, compared to 16 a year ago.
The median sales price for a condo/townhouse in Hillsborough County in May was $381,000 on 116 closed sales, down from $387,000 on 117 closed sales in May 2025. There were 142 pending sales, up 14.5% from 124 a year ago. Buyers need to act quickly, though. Condo/townhouse properties are on the market for an average 18 days in Hillsborough County, which is still an improvement over 12 days a year ago.
Rockingham County, on the Seacoast, had the state’s highest May single-family home MSP, at $717,500, a record, according to NHAR. The median was for 250 closed sales. The only other county with an MSP higher than the state’s was Grafton, in western New Hampshire, at $580,000 on 70 closed sales.
The least expensive homes in the state continue to be in Coos County, in the state’s northern tip, which had a May MSP of $269,900 on 27 closed sales, a price drop from $302,500 on 26 closed sales a year ago. Merrimack County’s $505,000 on 113 closed sales was also lower than May 2025’s MSP, which was $540,000 on 111 closed sales.
The state’s four-year-high pending sales numbers were reflected in county numbers, with nine out of the state’s 10 counties showing an increase.
The hottest county, percentage-wise, in the state in May was Belknap, in the Lakes Region, where there were 12 pending sales at the end of the month, up 59.5% from the previous year. Following that was Carroll County, Belknap’s Lakes Region neighbor, where there were 107 pending sales, up 42.7% from May 2025.
Other hot counties were Merrimack, with a 27.3% increase, representing 177 pending sales; Grafton, with 125 pending sales, up 23.8%; and Rockingham, with 348 pending sales, up 22.%.
The hottest county in year-to-date pending sales numbers was also Belknap, with 328, up 26.2% from this time last year. Rockingham was second with 1,111 pending sales, up 15% from last year.
Sullivan County, in southwestern New Hampshire, was the only one without a May year-over-year increase in pending sales, but the number didn’t go down, either, with 49 both this year and last. Year-to-date, the number was up 0.6%, to 177 from 176.
May’s national numbers
May median sales price in the U.S. was $417,700, up 0.9% from a year ago, according to the National Association of Realtors.
Inventory was up 5.8% month-over-month and 1.4% year-over-year, with approximately 1.47 million properties listed for sale heading into Maym a 4.4 months’ supply.
Home spent a median 32 days on the market, down from 41 days in April, with closed sales up 9,2% from the previous month.
Sales were up in the Midwest and South, but flat in the Northeast and down in the West.