
Over the past several weeks, the Northeast United States has seen significant reductions in air pollution over its major metropolitan areas.
Similar reductions in air pollution have been observed in other regions of the world. These recent improvements in air quality have come at a high cost, as communities grapple with widespread lockdowns and shelter-in-place orders as a result of the spread of COVID-19.
One air pollutant, nitrogen dioxide (NO2), is primarily emitted from burning fossil fuels (diesel, gasoline, coal), coming out of our tailpipes when driving cars and smokestacks when generating electricity. Therefore, changes in NO2 levels can be used as an indicator of changes in human activity.
However, care must be taken when processing and interpreting satellite NO2 data as the quantity observed by the satellite is not exactly the same as the NO2 abundance at ground level. NO2 levels are influenced by dynamical and chemical processes in the atmosphere.
For instance, atmospheric NO2 levels can vary day-to-day due to changes in the weather, which influences both the lifetime of NO2 molecules as well as the dispersal of the molecules by the wind. It is also important to note that satellites that observe NO2 cannot see through clouds, so all data shown is for days with low amounts of cloudiness. If processed and interpreted carefully, NO2 levels observed from space serve as an effective proxy for NO2 levels at Earth’s surface.
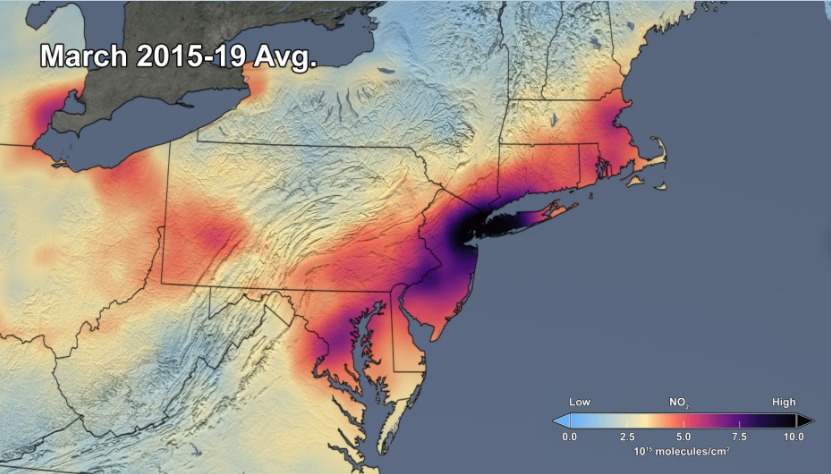
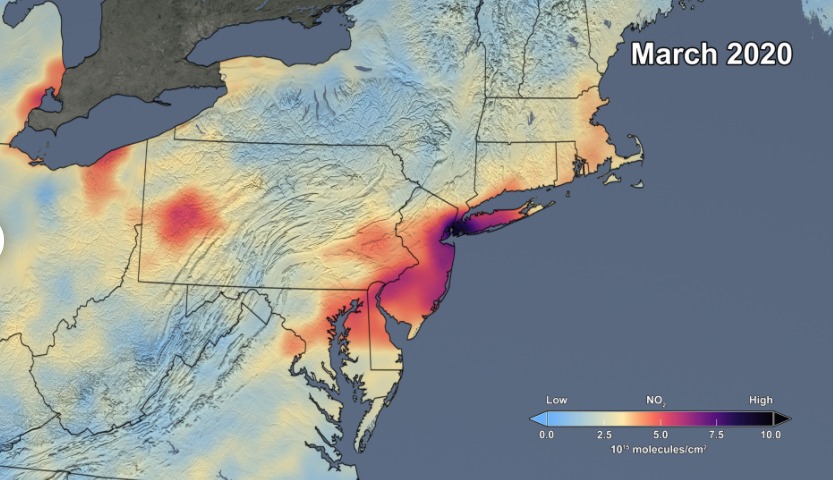
Though variations in weather from year to year cause variations in the monthly means for individual years (see animation above), March 2020 shows the lowest values as compared to any of the monthly values for March during the OMI data record, which spans 2005 to present. In fact, the data indicate that the NO2 levels in March 2020 are about 30% lower on average across the region of the I-95 corridor from Washington, DC to Boston than when compared to the mean of 2015 to 2019.