

CONCORD, NH – The single-family home market in New Hampshire continued to loosen slightly, with closed sales, listings and inventory all up in October from where they were a year ago.
The market improvements weren’t enough, though, for a significant change in median sales price for a single-family home, which remains way out of the affordability range for the average New Hampshire resident, according to October’s market statistics from the New Hampshire Association of Realtors.
The median sales price for a single-family home in New Hampshire in October was $527,950, up 4.5% from $505,000 in October 2024, but down from September’s $535,000. Median means that half of the properties sold for more, half for less.
Those buying inside the Manchester city limits paid a median $470,000, well below the state MSP, but inventory in the city is tight and buyers are paying well above list price.
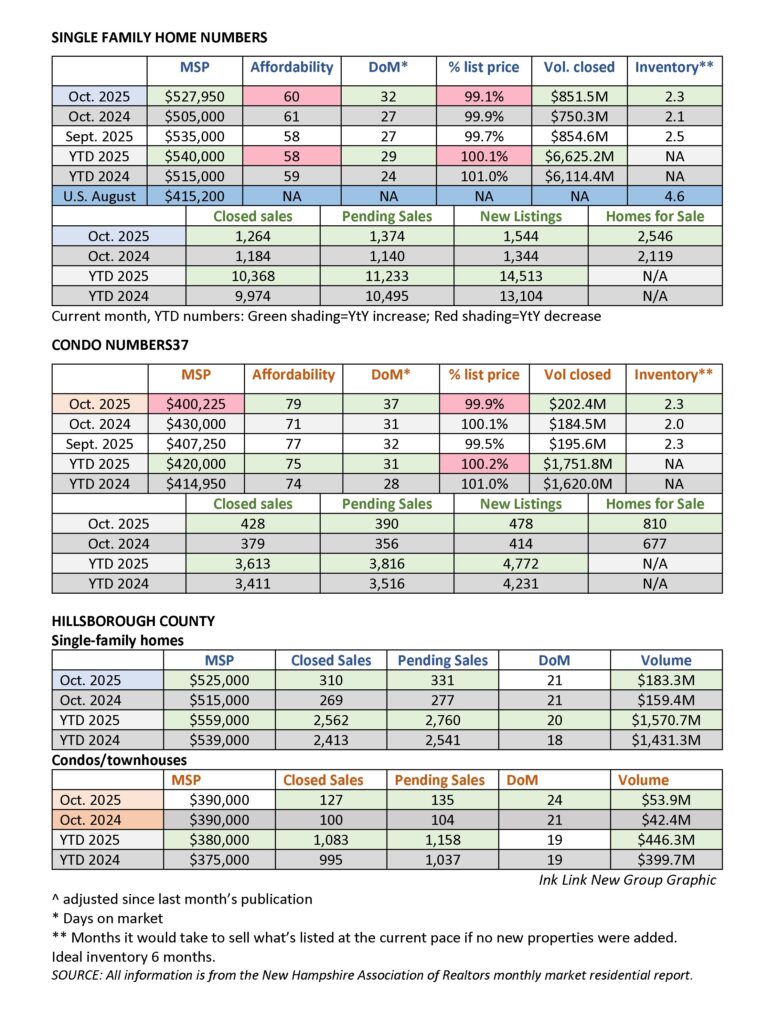
The affordability index for those who want to buy a single-family home in New Hampshire was 60 in October, down from 61 a year ago, but up from September’s 58. The index measures how affordable a median-priced home is for a household earning the state’s median income. An index of 60 means that the median income is 60% of what’s needed to afford monthly payments on a home, including mortgage, insurance and property tax.
Sales indicators all were higher than they were in October 2024. Closed sales were up 6.9% (1,264 in October vs. 1,182 in October 2024), pending sales were up 20.5% (1,374 vs. 1,140), new listings were up 14.9% (1,544 vs. 1,344), and overall homes for sale were up 20.2% (2,546 vs. 2,119).
Inventory was at 2.4, which means it would take 2.4 months to sell what was available on the market at the current pace if no more properties were added. That’s up from 2.1 a year ago, and marks six months that it’s been above 2. Inventory of six months or more is needed for a healthy market.
Inventory also went through a six-month May to October stretch of being above 2 last year before dropping below it in November, and staying there until May.
The last time there was a full 12 straight months of New Hampshire single-family home inventory of 2 months or higher ended July 2020, when inventory was 2. The next month, August 2020, inventory was at 1.8, the first time it had gone below 2 since June 2012, when the stat is first publicly available. That month, it was 15. And, here’s a touch of nostalgia – affordability index was 189 and MSP was $208,000.
Inventory didn’t go above 2 again for 24 months, until August 2023, when it was 2.1.
Home buyers in October got a little more of a break than they have recently. Single-family homes stayed on the market an average 32 days, compared to 27 a year ago. It was also 27 in September. Buyers paid an average 99.1% of list price, down from 99.9% a year ago and 99.7% in September.
Manchester October home sales
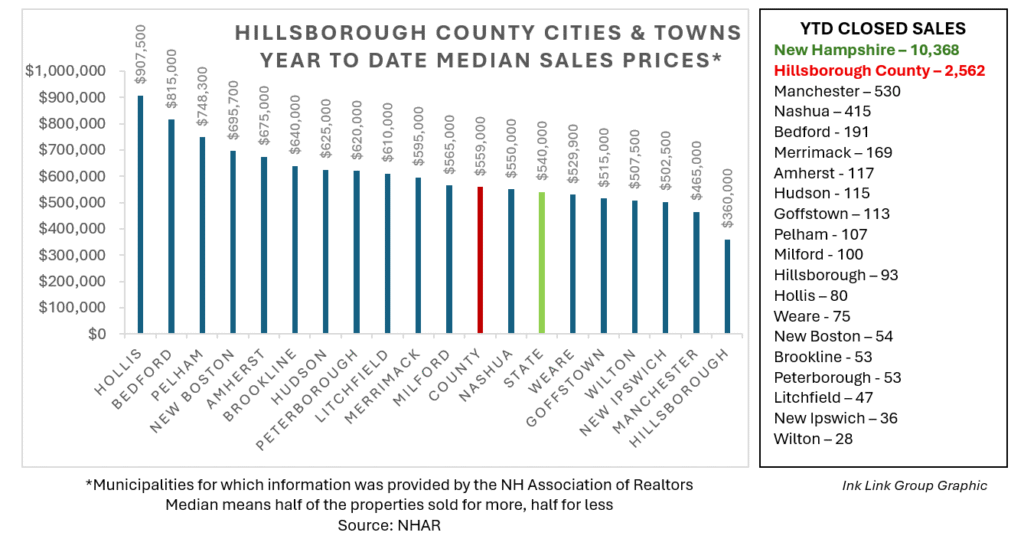
The median home price in Manchester in October was $470,000 for 66 properties closed on, well below both the state and county median. Those numbers are almost identical to October 2024, when the MSP was also $470,000, with 67 properties closed on. There’s a big difference in the year-to-date medians, though. The MSP for the first 10 months of 2025 is $465,000. At the same point in 2024, it was $435,000.
Median list price is also higher, with sellers in October taking more of a hit. Median list price this October was $457,500, with buyers paying an average 101.7% of list. In October 2024, the median list price was $439,900, and buyers paid an average 102.5% of list price. [If the math compared to closed sales is off, it’s because median list price includes homes still on the market].
Inventory in the city, with a population of 116,386 is extremely tight, with 1.2 months’ supply of inventory. That’s better than last year, though, when inventory was 0.9. Home stayed on the market an average 17 days in October, compared to an average 15 days in October 2024.
The same sales indicators that are looking good for the state also look good in the city. Though there were only 60 pending sales at the end of October, compared to 62 last year, new listings are up 23.3% [90 vs. 73] and inventory of homes or sale is up 51.2% [65 vs. 43].
Overall for the year so far, all sales indicators are up. Closed sales is up 7.9% [530 vs. 491], pending sales are up 8.5% [562 vs. 518] and new listings are up 12.9% [648 vs. 574].
Condo/townhouse October market
The much smaller statewide condominium/townhouse market was more affordable for buyers in October than it’s been recently.
Because the amount of overall inventory in that market is so low, there are steeper highs and lows than in the single-family home market – the sale of a few high-priced luxury condos has a much greater effect on MSP.
The median sales price for a condo/townhouse in October was $400,225, down from $430,000 a year ago and $408,500 in September. The affordability index for a condo/townhouse was 79, up from 71 a year ago and 76 in September.
As with single-family homes, all sales indicators showed improvement from 12 months before. Closed sales were up 12.9% (428 vs. 379), pending sales were up 9.6% (390 vs. 356), new listings were up 15.5% (478 vs. 414), and overall properties for sale were up 19.6% (818 vs. 677).
Inventory was 2.3, compared to 2.0 in October 2024. It’s been holding steady at 2.3 since June, with a blip up to 2.4 in July.
Also similar to the single-family home market, condo/townhouse buyers got a break, with property staying on the market an average 37 days, compared to 31 a year ago. Buyers who closed in October paid an average 99.9% of list price, compared to 100.1% a year ago.
County home sales for October
In Hillsborough County, which includes Manchester and Nashua and is the state’s most populous, the median sales price for a single-family home in October was $525,000, with 310 properties sold, up from $515,000 with 269 properties sold in October 2024. MSP in Hillsborough County was $570,000 in September.
Single-family homes in Hillsborough County spent an average 21 days on the market in October, the same as a year ago. There were 331 pending sales at the end of the month, up from 277 a year ago.
Buyers looking for a townhouse/condominium property didn’t get much of a break in Hillsborough County in October. Median sales price was $390,000 on 127 properties, the same MSP as 12 months ago on 100 properties. Condo/townhouses spent an average 24 days on the market as opposed to 21 a year ago. At the end of the month there were 135 pending sales, compared to 104 a year ago.
The best bargain for a single-family home in the state continues to be Coos County, the northernmost and least populous county in the state, where median sales price in October was $249,500 on 44 properties, down from $299,900 on 37 properties a year ago.
The most expensive county to buy a single-family home was in Rockingham County, on the Seacoast, where MSP was $668,000 in October on 247 properties, up from $629,000 on 258 properties a year ago.
The least expensive condo/townhouse properties in the state could be found in Sullivan County, on the state’s western border, with an MSP of $268,750 on four properties. None were sold in October 2024.
The most expensive condo/townhouse properties sold in October were in Coos County, were MSP was $742,000 on two properties sold, that’s up from $425,000 in October 2024, when three were sold.
The most volume for condominium/townhouse properties in the state is in Hillsborough and Rockingham counties. So far this year, the MSP in Hillsborough is $381,000 on 1,083 properties sold. A year ago, it was $377,500 for 995 properties. In Rockingham County, 1,223 properties have been sold this year, with an MSP of $520,000. Last year the MSP was $530,000 on 1,171 properties.
The national outlook
The median sales price for a single-family home in the U.S. in October was $415,200, up 2.1% from October 2024, according to the National Association of Realtors.
Sales of existing single-family homes were up 1.5% month-over-month and 4.1% year-over-year, reaching a seasonally adjusted annual rate of 4.06 million units.
The increase was partly driven by falling mortgage rates, which recently hit their lowest level in more than a year, the NAR said in its monthly report. Regionally, monthly sales advanced in the Northeast, South, and West, while there was a slight decline in the Midwest .
There was a 4.6 months’ supply in housing inventory, up 1.3% from September, and 14.0% higher than October 2024.
The biggest year-over-year sales price increase was in the Midwest, followed by the Northeast and the South. Prices stayed mostly flat in the West, according to the NAR.